
How to Build a Financial Dashboard

In this post, we’ll show you how to build a financial dashboard that provides more than just data—it delivers clarity, alignment, and control. For founders of growth-stage businesses, having a real-time view of your company’s financial performance isn’t a luxury. It’s a necessity. But too often, dashboards are either too complex to be useful or too simple to be strategic.
A well-built dashboard should serve as a control panel for your business. It should help you track performance, forecast problems, and make smarter, faster decisions. Most importantly, it should give your leadership team a shared language to align around.
Key Takeaways
-
A good dashboard tracks the right financial metrics—not all of them
-
Simplicity, structure, and consistency are more valuable than complexity
-
Dashboards should drive decisions—not just display data
-
When reviewed regularly, they align leadership and improve outcomes
Define the Purpose Before Choosing the Platform
Before you jump into tools or design, get clear on what your dashboard is supposed to help you do. Is the goal to monitor profitability? Improve cash flow visibility? Drive accountability within your leadership team? Without a clear purpose, it’s easy to build a dashboard that looks impressive but tells you very little.
The right dashboard isn’t one-size-fits-all. A service-based business might need to track labor efficiency by project. A product company might need to watch inventory turnover or margin by SKU. Start by identifying the outcomes you care about—then build backwards from there.
Choose the Right Metrics (Not the Most Metrics)
This is where most dashboards fail. Business owners try to track everything—thinking more data means better insight. But the opposite is true. Clarity comes from focusing on the few metrics that truly drive your business forward.
Here are some foundational KPIs to consider:
-
Revenue: both monthly and trailing 12-month views
-
Gross margin: by product, service, or segment
-
Net income: tracked against targets
-
Cash flow: especially free cash flow and burn rate
-
Accounts receivable aging: to flag payment delays
-
Forecast vs. actuals: to track execution and planning accuracy
Pick 8 to 12 metrics maximum. Enough to tell the story, but not so many you lose the plot.
Structure Your Dashboard for Action, Not Just Reporting
Once you’ve chosen your metrics, organize your dashboard in a way that makes it easy to scan and interpret. Group related KPIs together—revenue and margin in one section, expenses and overhead in another, and cash position in its own space. Visuals should highlight movement and variance, not just snapshots. Trends matter more than standalone figures.
Make the dashboard usable by non-financial leaders. If your operations lead or sales director can’t quickly interpret what they’re seeing, the tool becomes a report—not a resource. Choose formats that emphasize direction: arrows, color codes, or month-over-month comparisons.
Create a Consistent Review Rhythm
A dashboard only works if it becomes part of how you lead. Build a regular cadence around reviewing your numbers. This might be weekly for tactical insights and monthly for strategic decisions. What matters is that your leadership team is aligned on what’s being tracked and uses the dashboard to drive discussion—not just to observe results.
In each review, answer three questions:
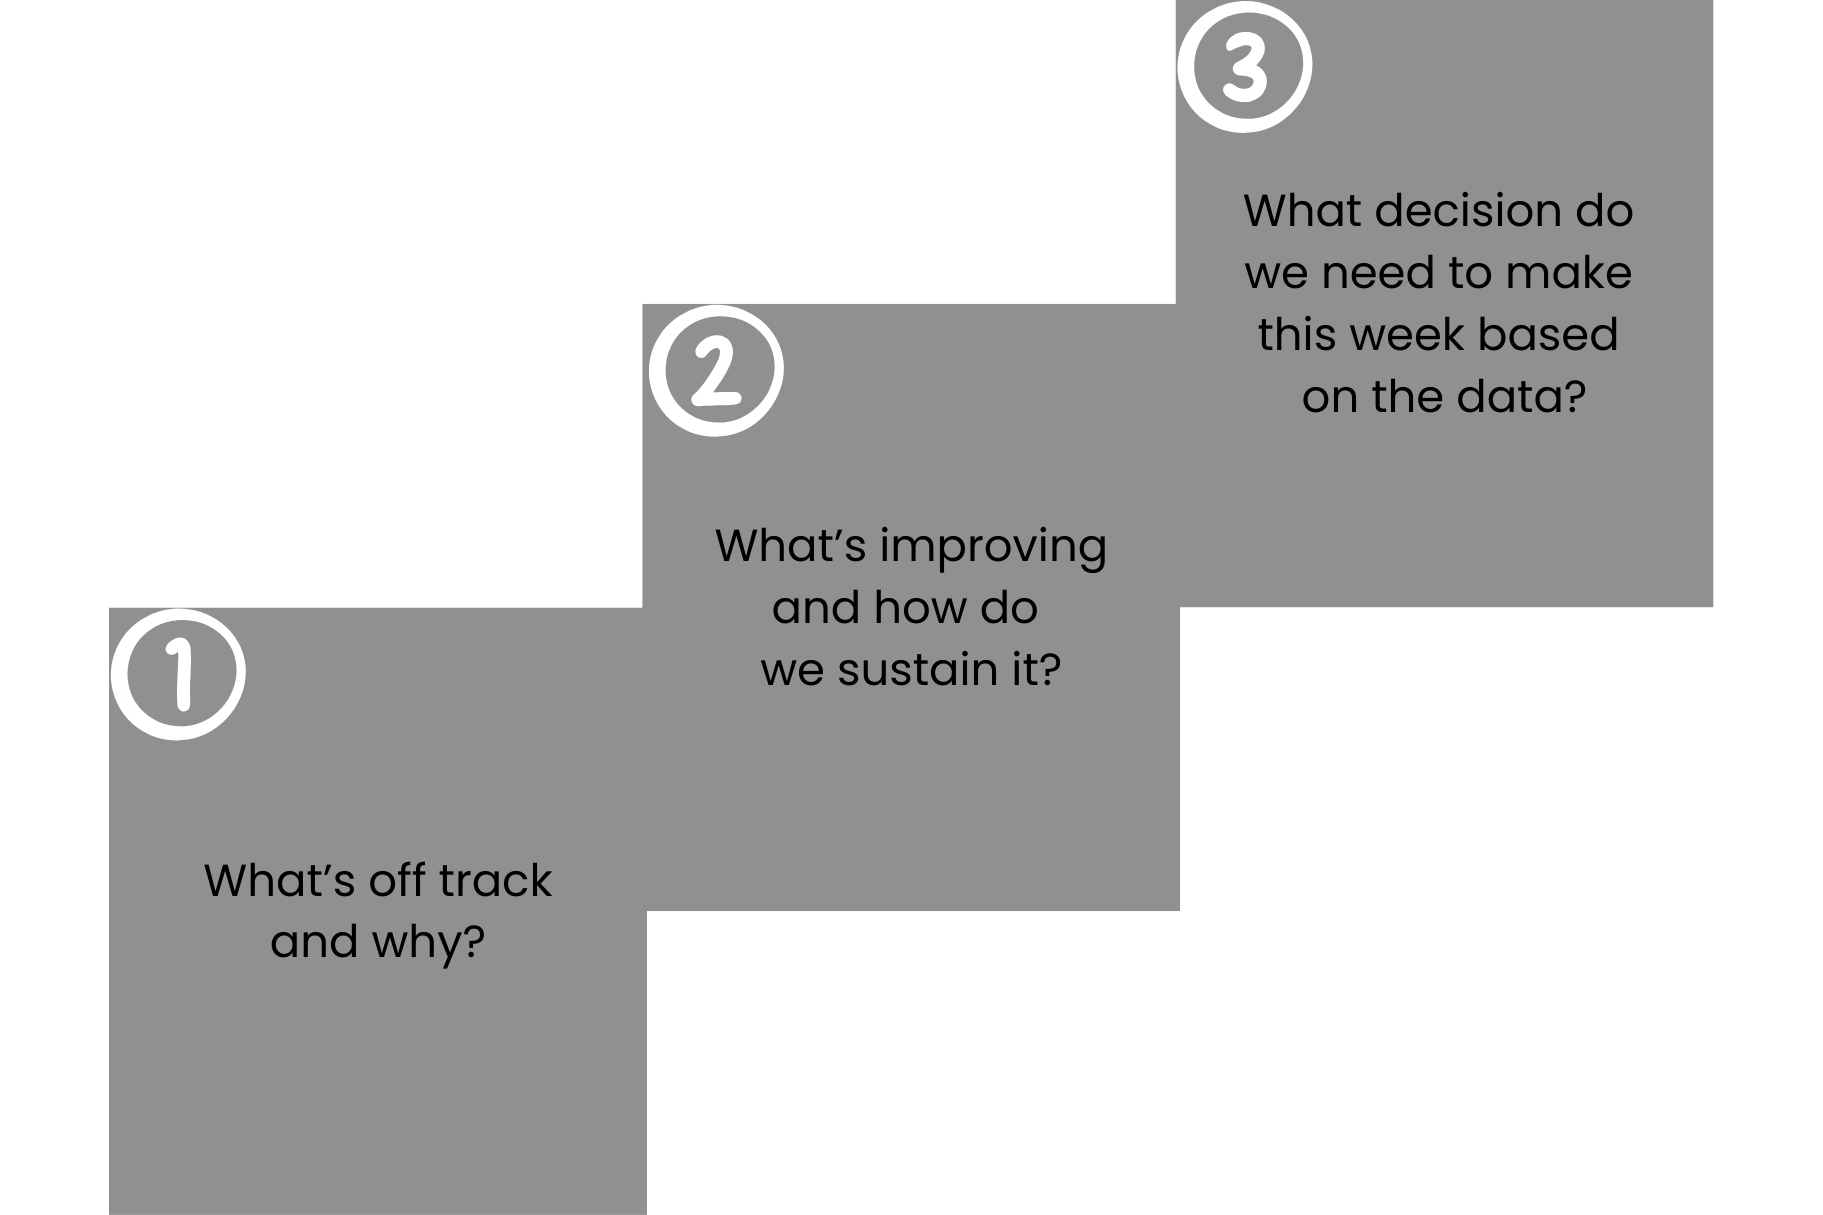
This rhythm transforms your dashboard from a static spreadsheet into a dynamic management system one that drives focus, alignment, and smarter decision-making. It shifts the way your team interacts with data—turning insights into action and meetings into meaningful momentum.
Keep It Lean, Updated, and Aligned
A dashboard is not a one-time project. It needs to evolve with your business. As your goals shift, your metrics should too. Remove outdated KPIs that no longer reflect your priorities. Add new ones when needed. And most importantly, keep it current. A financial dashboard that’s 30 days behind is a lagging report—not a leading tool.
Assign ownership. Make sure someone is responsible for updating the numbers, maintaining accuracy, and pushing out insights. The best dashboards are living systems that evolve with your operations—not static templates.
Final Word: A Dashboard Is a Leadership Tool
A strong financial dashboard doesn’t just show you where you are—it helps you decide where to go next. It turns financial performance into something visible, measurable, and manageable. And for fast-growing businesses, it creates the clarity needed to scale with confidence.
At Coltivar, we help founders build financial dashboards that connect high-level goals to day-to-day execution—so leadership becomes more proactive, and performance becomes predictable.
Want to build a financial dashboard tailored to your business model and goals?
Book a Strategy Review and let’s design one that gives you clarity and control.